
What is that fancy graph
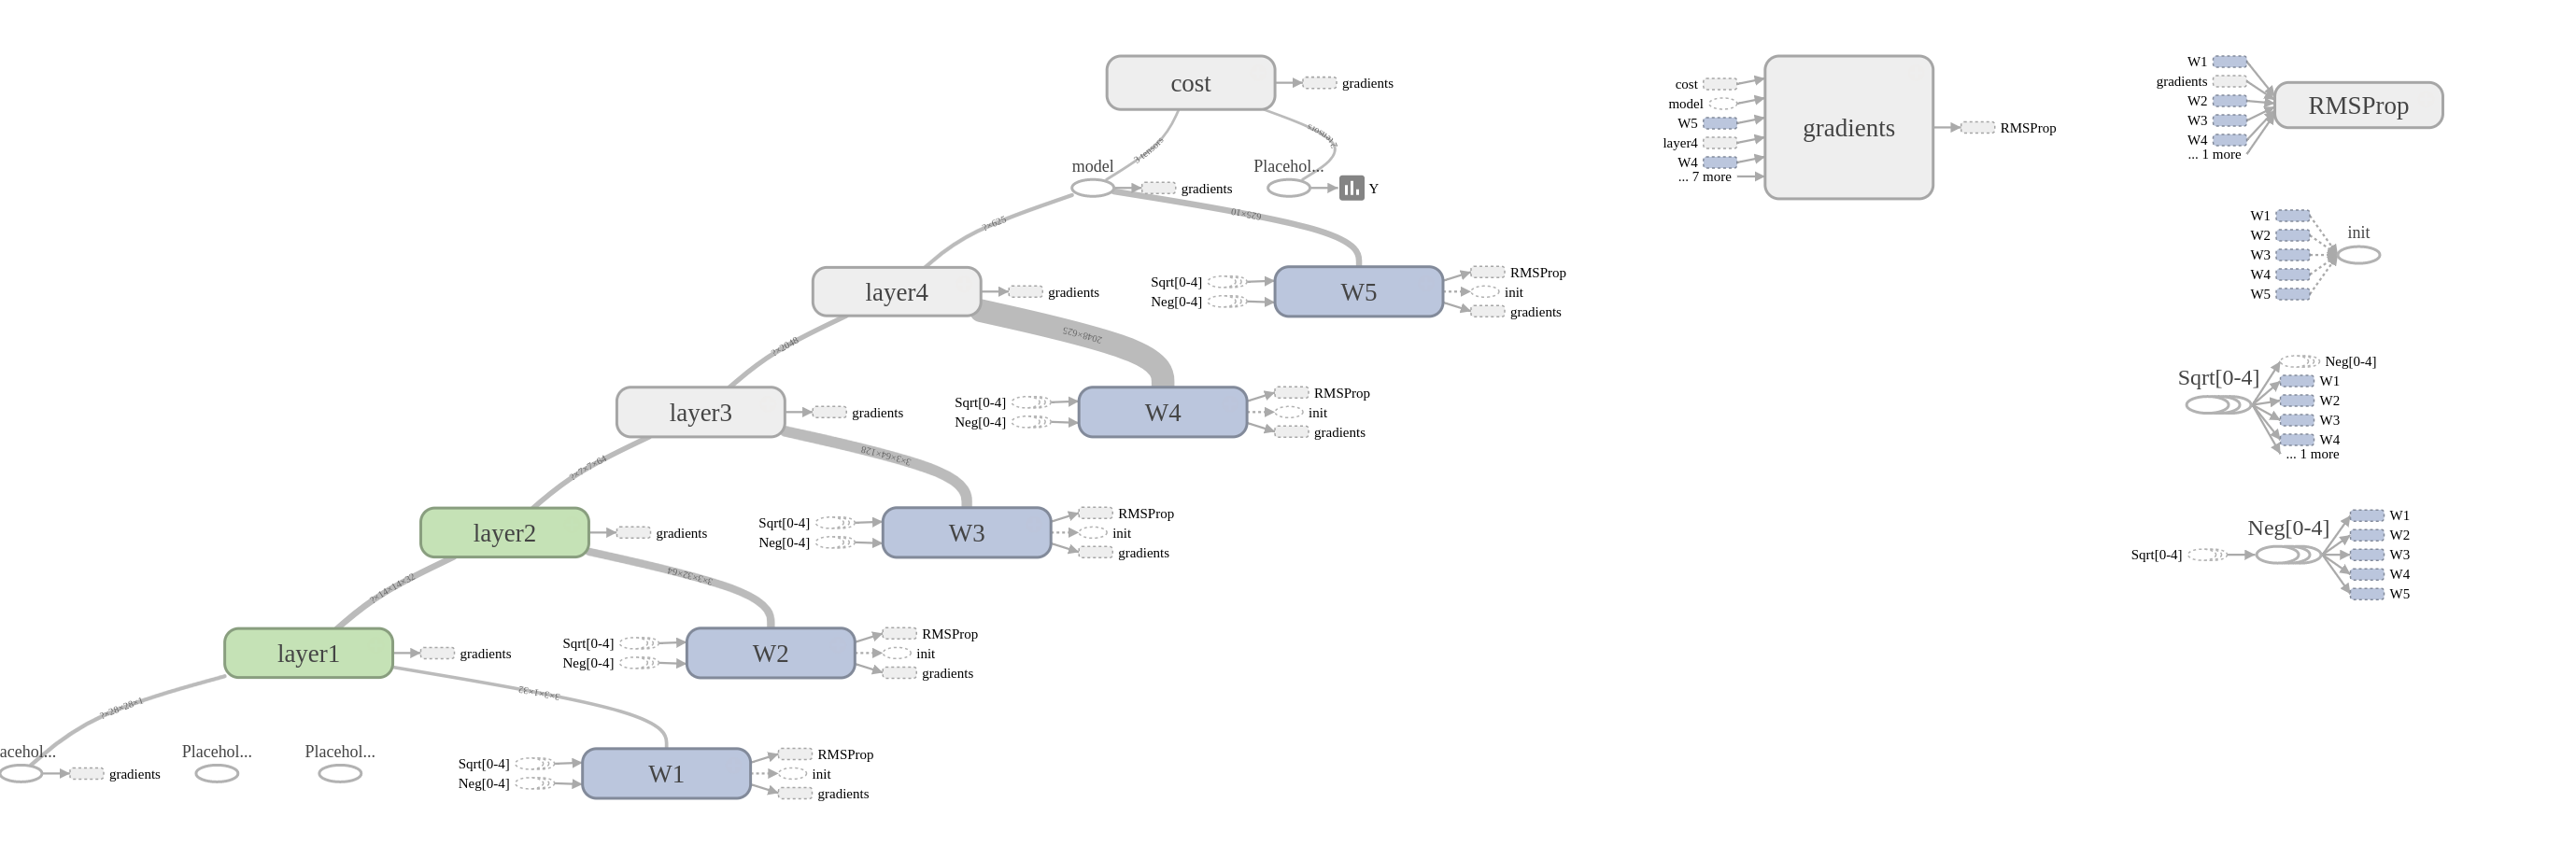
For my 11th grade science fair project, I studied artificial intelligence and its mathematical roots by building a convolutional neural network (a special deep neural network adapted for images) capable of recognizing handwritten digits.
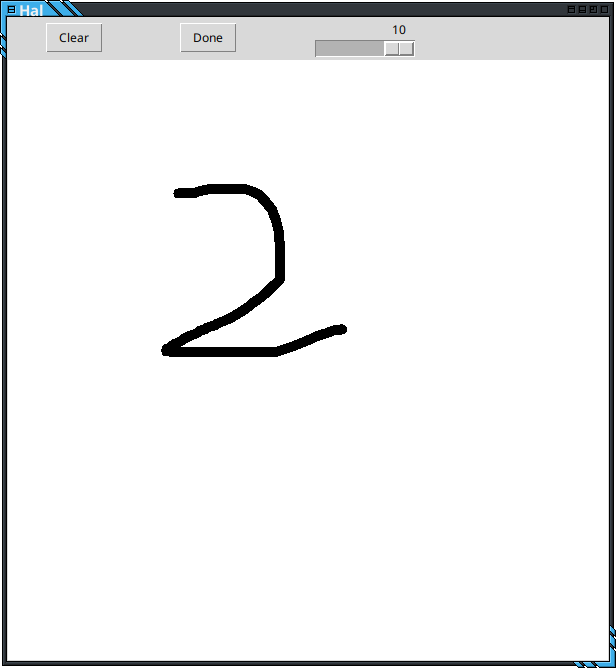
This project consists of a pipline:
- The user inputs the raw drawing
- The system crops this drawing, turns it into a square, and resizes it
- This modified image is passed through the CNN (which was trained earlier)
- A prediction is made
Awards
This project won 1st place out of the entire high school for the science fair.
Some more beautiful graphs
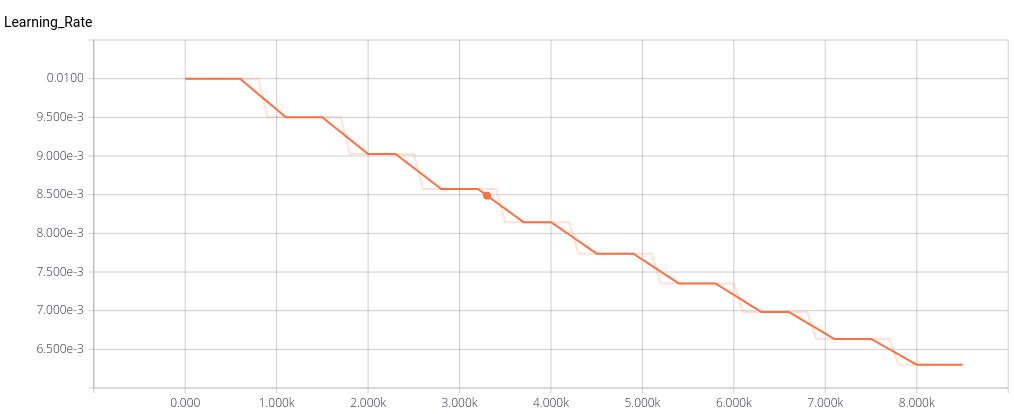
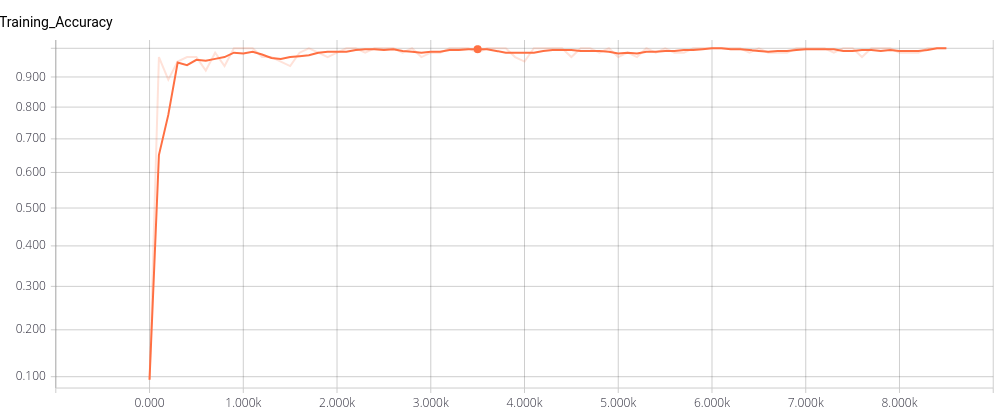
But wait, there’s more!
I have open sourced the code, and you can check it out on Github here . It is pretty neat if I may say so myself, so feel free to just clone and run it if this piques your interest.